
The same votes. Three different outcomes.
How the neutral maps are made
State by state
Pick a state to compare the three different seat counts.
Democratic vote share by district
In detail
Competitive districts
Redraws since 2024
By political control
The tables show who adopted a map, not the intent behind it. A map adopted under one party's control can still fall inside the neutral band.
| Control | States | Seats | Drawing effect |
|---|
| Adopted by | States | Seats | Drawing effect |
|---|
Maps in court
Beyond district lines
Senate in 2026
Videos
How House elections work
Text in the video
November 3. All 435 House seats are up for election.
Seats are divided among the states by population.
Most states are split into districts. One district, one seat.
Win the district, win the seat. Second place gets nothing.
218 seats is a majority.
Every federal law and every budget must pass the House.
A law: fill every pothole. A budget: $12 billion.
The winner decides which bills get a vote and chairs every committee.
Who draws the districts? In most states, the state legislature. After every census. Several states redrew in 2025 and 2026.
Why is this important?
Same voters. Different lines. Different winners.
See what the lines do in your state.
somevotes.org
How to rig a map
Text in the video
Two ways to rig a map.
Ten of 25 voters are blue. Most live in the city.
Compact districts: blue wins 2 of 5.
Packing. Squeeze them into one district. They win it big, and waste votes.
Cracking. Slice them up. They lose everywhere, by a little.
Tennessee: Nashville and Memphis cut into slices. 37% of the votes. 0 of 9 seats.
Illinois: Republicans packed into three districts. 41% of the votes. 3 of 17 seats.
Both parties do it.
See what the lines do in your state.
somevotes.org
You may reuse the videos, also commercially, under CC BY 4.0. Credit: Govert Schoof, Geodienst, University of Groningen, somevotes.org.
Graphics to reuse
Two images for articles and posts. Each one names the votes, the date of the maps, the sources and this site.
More
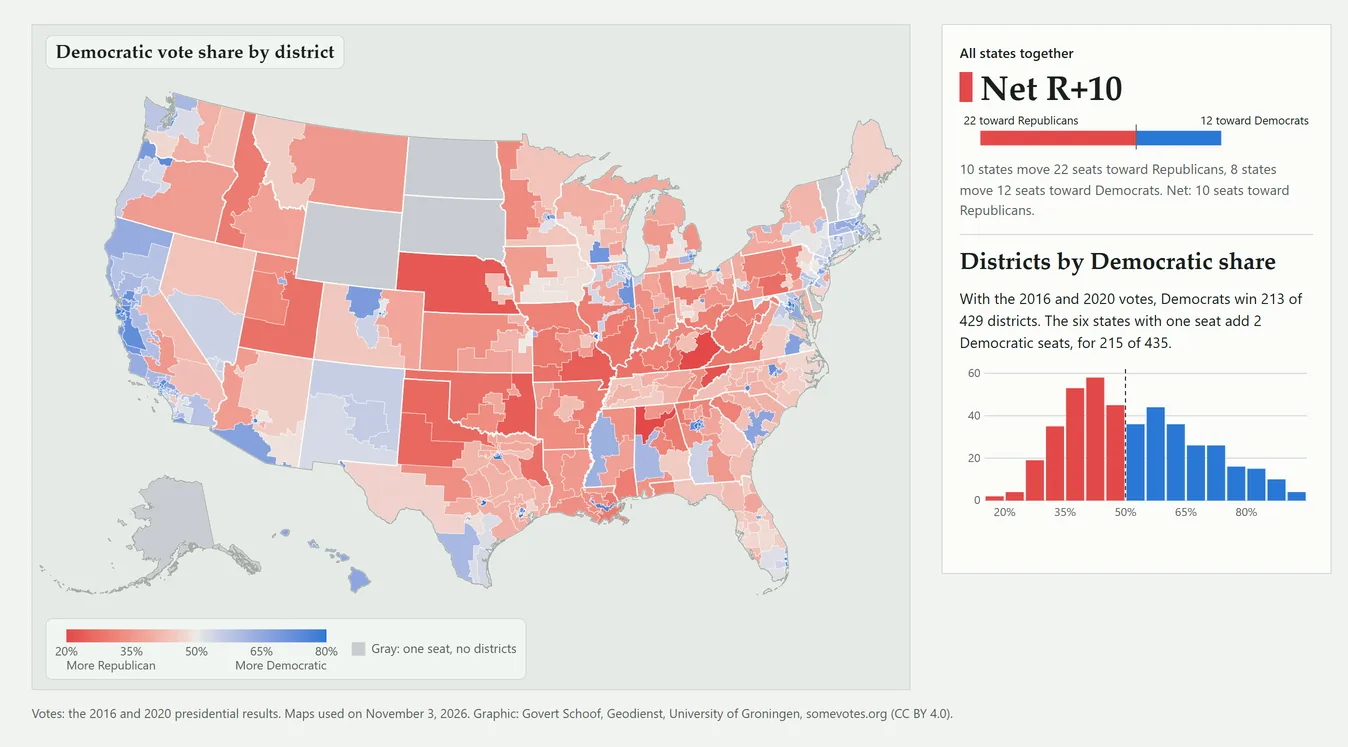
Votes: the 2016 and 2020 presidential results. Maps used on November 3, 2026. Graphic: Govert Schoof, Geodienst, University of Groningen, somevotes.org (CC BY 4.0).

You may reuse the images and their captions, also commercially, under CC BY 4.0. Credit: Govert Schoof, Geodienst, University of Groningen, somevotes.org.
Methodology
How the seats are calculated Votes, neutral maps, the Voting Rights Act, known limits, sources
How to read the three numbers. All numbers count Democratic seats in the U.S. House. Vote-proportional gives each state's seats in proportion to its two-party vote. Neutral-map median is the median of maps per state drawn by a computer that follows each state's rules but ignores party. Enacted maps is what the maps used on November 3, 2026 produce with the same votes. The difference between the first two is the geographic effect; the difference between the last two is the drawing effect. The neutral maps follow the rules ALARM applied in each state, such as the Voting Rights Act and old district cores in five states. In Arizona and Colorado they also favor competitive districts, which takes vote data. Both effects include what these rules do. An effect shows its direction: R+6 means 6 seats toward Republicans, D+3 means 3 seats toward Democrats.
The six states with one seat. Alaska, Delaware, North Dakota, South Dakota, Vermont and Wyoming elect one representative for the whole state. There is nothing to draw, so all three counts give the same result: the party that won the state in 2016 and 2020, Democrats in Delaware and Vermont and Republicans in the other four. The national numbers include these six seats; they do not change the effects. On the vote slider none of the six changes sides, which the pipeline checks at every step.
Why neutral maps are not proportional. Each district elects one winner, so the party with more votes in a state usually wins a larger share of its seats than of its votes. Democratic voters also live closer together, mostly in cities, so neutral maps often put many of them in a few districts that Democrats win by large margins. The geographic effect is the sum of both.
Votes. We use the 2016 and 2020 presidential results added together, by voting district (by census tract in California, Hawaii, Maine and Oregon, by county in Iowa and West Virginia; West Virginia uses 2020 only), as prepared by the ALARM Project. The enacted seats come from assigning these votes to the 2026 districts, not from House results. With these votes the enacted seats can differ from what happened in 2024. We use presidential votes because House results depend on the maps themselves: in safe districts one party often has no candidate, and incumbents run ahead of their party. Presidential votes are cast everywhere for the same two candidates, so they can be counted on any map. Adding 2016 and 2020 evens out the candidates of a single year. In 2024 Democrats won of the two-party presidential vote; the vote slider in chapter 01 shows a year like that.
The Voting Rights Act. The law can require districts where a minority group forms a large share of the voters. In seat counts such districts can look like packing. ALARM's neutral maps follow the Voting Rights Act as courts applied it before Louisiana v. Callais (April 2026). Where a map adopted after that ruling removed such districts, the change shows up in the drawing effect. The notes per state say what ALARM did there.
Neutral maps that keep old district cores. In Kansas and Nebraska, ALARM's neutral maps keep the cores of the districts drawn after the 2010 census. In Louisiana, New Mexico and Utah they keep those of the 2021 or 2022 map. In New Mexico, and largely in Louisiana, that pulls the drawing effect toward zero.
The national band. The national neutral-map median combines the states as if their neutral maps were drawn independently. The national effects therefore differ slightly from the sum of the state effects.
Extensions. The majority threshold shifts every district's Democratic share by the same amount until Democrats hold of the seats, the six states with one seat included. The vote slider in chapter 01 uses the same shift for every district, every neutral map and every state, from 47% to 56% of the two-party vote. The enacted maps have fewer competitive districts than neutral maps, so they move less when the vote shifts, and the drawing effect depends on the vote share. Competitive districts have a Democratic share from 45% to 55%, both included. The map view "Districts: close races" shows them in the color of the party they lean to, with a dot where the parties are less than 5 points apart and a larger dot under 2 points; its swing states vote 48.5% to 51.5% Democratic on the 2016 and 2020 votes together. Redraws compare the 2026 maps with the maps of the 2024 election (U.S. Census Bureau, 119th Congress). "Adopted by" says which body adopted the map and which party, if any, could adopt it alone. The Senate block takes the 35 seats on the ballot on November 3, 2026 (33 regular seats and special elections for the seats that JD Vance in Ohio and Marco Rubio in Florida left in 2025) and the parties that hold the other 65, from the U.S. Senate's lists as of . The two independents count with the Democrats, with whom they caucus. Each seat on the ballot goes to the party that won its state's presidential vote in 2016 and 2020 together, shifted by the same amount as on the vote slider. A majority is 51 of 100 seats: at 50 to 50 the vice president, a Republican since January 2025, decides. If all 100 seats were chosen at once, with both seats of a state going to one party, Democrats would need of the two-party vote for states, because every state has two senators whatever its population.
Known limits.
- The smallest vote units are voting districts in 38 states, census tracts in California, Hawaii, Maine and Oregon, and counties in Iowa and West Virginia, as in ALARM's map files. Where such a unit crosses a district line, we split its votes over its census blocks by voting-age population. In the four tract states the split follows the block votes in ALARM's census-2020 files.
- In California, ALARM's map file has no votes for two census tracts in Modoc and Siskiyou counties. ALARM's census-2020 block file gives them about 4,100 votes in 2016 and 2020 together. We follow the map file, so all three numbers use the same votes.
- In Michigan, ALARM's map file leaves out 38 voting districts that cover water. ALARM's census-2020 data gives them 17,273 votes, which we do not count. In Ohio the map file leaves out 4 such districts, which have no votes.
- ALARM's census-2020 block file for Maine is from October 2025 and spreads the votes over the tracts differently from the map file. We use it only to split each tract's votes over its blocks; the votes per tract come from the map file.
- For New Jersey, ALARM's map file has the 2020 results from before ALARM revised its census-2020 file for that state. We follow the map file.
- For a voting district or county without voting-age population, we split its votes equally over its blocks. On the 2026 maps such units with votes cross a district line in eight states, with about 4,500 votes in total.
- We do not check the enacted maps for equal population. Nevada and California count prisoners differently from the census when they redistrict.
- A district number can mean a different area on another map, as in Utah, so district numbers cannot be compared between maps.
- With the 2016 and 2020 presidential votes, TX-15, TX-28 and TX-34 count as Democratic districts. On the same lines, all three voted Republican for president in 2024, according to the Texas Legislative Council.
- In Louisiana the Voting Rights Act requirement and the kept district cores together nearly fix the outcome. Of the neutral maps, give .
- ALARM is rerunning its neutral maps for 11 states. Its separate runs of version 15 give the same national median and band, and the same median in those 11 states. In Texas one run gives 18 Democratic seats instead of 17, because the median lies on the edge between the two.
Sources. Neutral maps and votes: ALARM Project, 50-State Redistricting Simulations, version (McCartan, Imai and others; Harvard Dataverse, doi:10.7910/DVN/SLCD3E), CC0. ALARM describes the data in McCartan, Kenny, Simko, Garcia, Wang, Wu, Kuriwaki and Imai, "Simulated redistricting plans for the analysis and evaluation of redistricting in the United States", Scientific Data 9, 689 (2022), doi:10.1038/s41597-022-01808-2. Overview of paper, data and code: imai.fas.harvard.edu/research/50states. ALARM's vote data build on precinct results from the Voting and Election Science Team (CC BY 4.0). Block votes for splitting tracts in California, Hawaii, Maine and Oregon: ALARM Project, census-2020 files (CC BY-SA 4.0). Boundaries and block files: U.S. Census Bureau, TIGER/Line 2026 (2025 for Missouri), the 2025 cartographic boundary file for the state outlines, and the block equivalency files for the 118th, 119th and 120th Congress (public domain). Presidential results of the six states with one seat, for the Senate block, and the national shares of 2016, 2020 and 2024: MIT Election Data and Science Lab, U.S. President 1976-2024, version 10.1 (Harvard Dataverse, doi:10.7910/DVN/42MVDX), CC0. Senate seats on the ballot and party division: U.S. Senate, Class II and Class III senators and party division, as of . Legal status as of . Cross-checked against PlanScore for seven states.
About this project
Made by Govert Schoof, founder of the Geodienst, the geospatial expertise centre of the University of Groningen, liaison at Jantina Tammes School, and co-founder of Geominds.nl, which builds geo-AI for real-world mapping.
Thanks to scholars Mark Thompson and Jelte Olthof from American Studies in Groningen.
Thanks to Vincent, JW, Elmeri and Bart Campman for reviewing the work and for their feedback.
Thanks to the ALARM team (McCartan and others, Scientific Data, 2022), PlanScore and all other open data projects.
This project has no client and no funding. I made it because I thought it was worth doing.
Questions or corrections: please contact the press office of the University of Groningen. Errors will be corrected.